Specification
Alertas+ system specification - Alertas+ of Pressure and Threats in territories.
Version 1.0.0 - Cycle v2.0.0 - 2021.
By Antonio Oviedo, Alana Almeida de Souza, Cicero Augusto, João Ricardo R. Alves, Silvio Carlos, Tiago Moreira dos Santos, William Pereira Lima, Juan Doblas.
Contact: alertas@socioambiental.org.
Summary
Recent studies have demonstrated the high degree of effectiveness of protected areas to maintain forest cover, reinforcing their role as shields from deforestation and pointing out the need to strengthen public policies to protect these territories. Doblas e Oviedo (2021) analyzed the trajectories of change of land use during 33 years (between 1985 and 2018) within a set of 1.648 protected areas of traditional occupation and corresponding buffer zones, in every Brazilian biome. The results indicate a progression of deforestation over time, this trend being bigger in the surroundings of the protected areas of traditional occupation than in their interiors. Amazon’s Indigenous Lands, for example, are the protected areas that most preserve vegetation cover, that is, only 1,2% of the territory lost its vegetation cover.
Adding to these studies, this specification is about incorporation, modelling, analysis and data availability to support the production of environmental knowledge of the protected areas (ARPs), as well as the development of a visualiztion panel about deforestation alerts and forest degradation in Legal Amazon that compose the Alertas+ system.
It still documents decisions of design, engineering and methodological assumptions used in the agile estimates of alerts of territorial pressure/threats.
The proposed model of the Alertas+ system allows the continuity of researches on the changes of trajectories of land use and the effectiveness of protected areas. The comprehension of the factors responsible for the changes in trajectories of land use is essential for the planning and formulation of public policies of land use.
Objectives
Alertas+ seek to solve several problems, especially in the following dimensions:
Informative: quickly answer several questions on threats occurring inside and outside protected areas.
Narrative: the need to explicitly communicate the role of protected areas as “guardians of the forests” and providers of socio-environmental services. In the cases that the protected areas are threatened, Alertas+ helps in the identification of pressures in these territories.
Strenghts
Alertas+ has the following features:
Resilience: it does not rely upon a single data source, being prepared for occasional access problems, updates and quality from specific sources.
Data export to open formats.
Data available via API can be used in other systems.
Project structured for import, processing and making available geospatial data: new dataset can be easily incorporated into the system.
Periodical and automatic import with human supervision guarantee qualified analysis and almost in real time.
Differentials
Alertas+ aims to be a complementary system to existing ones, contributing with the following differentials:
It fills the gap of data crossed with protected area using the bank of areas plotted by ISA, largely known for its quality.
It offers a single interface where data from several sources are made available to anaylisis and comparison.
It allows several possibilities of crossings and questions to a big dynamic databank. Alertas+ datapanel allows the viewing of imported sets as the advanced selection of spatial and land subsets.
It is easy to use and understand, for the general public as well as experts: the panel has two modes, basic and detailed, with delimitation of modes with larger and smaller numbers of possible questions that is helpful for a smooth learning curve.
Multilingual (Portuguese, English and Spanish).
Responsive in mobile devices.
It performs experimental estimates of carbon emission.
It is based on the open science model, where open software and open data allow the reproducibility of computes as well as the enhancement of the system in a community way and the increase of resilience with a larger number of instances of system in use.
General view
The development of Alertas+ covered the following subsystems for the collection and processing of datasets:
The develpment of a subsystem that performs the discharge and incorporation of datasets through a crossing with a geospatialized base of protected areas.
The development of a subsystem for analysis of incorporated data, discriminating the classes mapped by by arbitrary time ranges (including, but not limited to: daily, biweekly, monthly, annual and total) and with spatial subsets like Indigenous Lands (TIs), Conservation Units (UCs) and the respective buffers, states, municipalities and hydrographic basin; as well as the preparation of results ind several outputs (API, CSV, JSON, GeoJSON e shapefile).
The implementation of periodic feeding routines, update of the geographical database, crossings and the several data output using the discharge subsystem and incorporation previously described.
The implementation of a API Web using the aforementioned analysis subsystem.
The requirements analysis and data modeling proposed by the ISA team also contemplated:
Providing documentation for the developed libraries, subsystems and databases.
That all source-code produced must be readable, well-structured and well-documented.
That the source-code and the documentation are released as open software in accordance with the GNU GPL versão 3 license or newer.
That the data necessary for third parties to run the application is also made available.
Development cycles
Initial development of Alertas+ system was divided in two cycles:
Cycle 1: Proof of concepts and basic structuring (2020):
Development of collection routine and automatic update of DETER’s deforestationdata.
Front-end prototype of data visualization (Alertas+).
Cycle 2: Incorporation of new data, improvement and public launch (2021):
Extension of the dataset: PRODES (INPE) (including the accumulated deforestation data up until 2007), FIRMS MODIS (NASA), FIRMS VIIRS (NASA), Amazon Dashboard (SERVIR) and SAD (IMAZON).
Transformation of the Alertas+ prototype into a product accessible to the public.
Source-code
The project resulted in the following code repositories:
Backend: responsible for the incorporation, analysis and provision of computes.
Frontend: query web interface.
All source-code is available under the GNU GPL v3 license.
Open data
Alertas+ is a system entirely based on open data:
It uses third-party datasets that are publicly available.
For the data complied by ISA, the downloads page keeps sets generated automatically and periodically and that also can be automatically incorporated by back-end instances.
Third party data is covered by their respective licenses, while data produced by ISA is made available by the license Creative Commons CC-BY-SA.
Solution detailing
E1 - Data Model
E1.1 - Entitites and Relations
The modeled databases meet the Entity-Relation model of this project based on the basic entities described below. However, both the final entities and relationships as well as the database model can be renegotiated during the next development cycles, with revision and adjustment as necessary:
Event of pressure/threat: also called “alerta”, it is the basic entity of computes, present in space and in time. The database must be generic to the point of supporting several events like DETER, FIRMS spot fires etc. An event can be specific or georeferred area.
Territory: also called frame from now on, it is the geospatialized entity where events occur, such as Indigenous Land (TI), Units of Conservation (UC) and buffers/surroundings associated with each of these areas; states, municipalities and hydrographic basins in Legal Amazon.
The relationships between the entities are given through the following diagram:
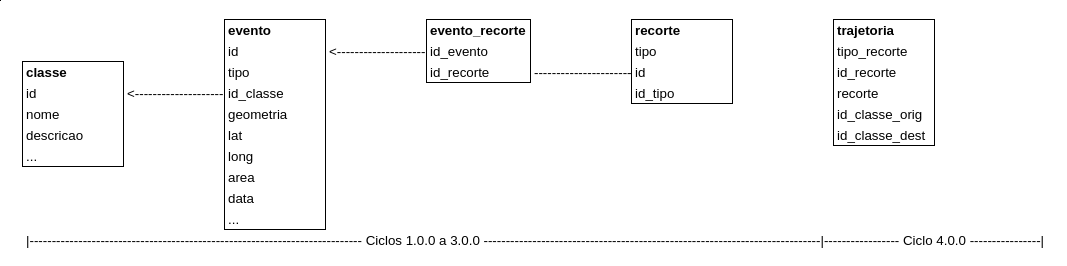
where:
evento can be an event DETER, Spot Fires, etc., containing geospatial field – polygon or point –, area (when applicable) and reference for class of event (equivalent DETER class) and municipality of occurence.
classe represents an element of a library of classes.
recorte is the geospatial entity (TI, UC, QUI, CAR, Município, UF, etc.) where the events occur and that can be related to other databaes and tables devoted to these entities through the fields recorte.tipo and recorte.id_tipo.
The abstraction made in the datamodel for the entities evento and territórios allows that a series of datasets be treated evenly, which consolidates routines of crossing and analysis and also facilitates the import of new sets, shown by the following diagram:
          PRODES --.
                    \
             SAD ----.
                      \
           DETER ---------> Eventos
                       ´
Amazon Dashboard -----´
                     ´
           FIRMS ---´


Geo ISA (ARPs) --.
                  \
          IBGE ------> Territórios
                  ´
         INCRA --´
E1.2 - Database Model
While the model of entities and relationships offers a higher-level view for the shape of datasets, the database model indicates how actually the entities will be stored aiming optimization of consultations.
E1.3.1 Modeling assumptions
The following assumptions were made for the creation of the database model:
In the near future, there will likely be a **considerable increase in pressure ** and threat events, which implies large data sets to be incorporated.
The creation of new computes and intersections should be simple to the point of not needing database remodeling.
The system must have enough performance to perform arbitrary selections without too long wait time.
E1.3.2 - Canonical and derivative bases
To satisfy these requirements, data in three modalities were considered:
Raw data: is the one obtained from the source, sucha as zip file, shapefile etc., whose storage occurs according to space availability and for purposes of verification, safeguarding and future uses.
Canonical database: where events and frames follow their original structures and are updated only by the institution of origin (author/authority), serving as reference data both for the purposes of this specification and for safeguarding data and future applications. Examples of existing canonical bases in ISA’s corporate banks include Fire Spots (INPE) and Violence (SisArp/CIMI); such available bases may be used in future cycles of the Panel.
Derivative database: computations are calculated from this canonical data and are stored in derived structures which are renormalized structures to optimize queries; the derived data, to some extent, is redundant data in relation to the canonical data, that is, it can be copies of canonical data in structures more suitable for final consumption or even the result of computations made from canonical data.
E1.3.3 - Segmentation and partitioning
To optimize queries, it was considered that tables derived from events are segmented and/or partitioned by:
Type of event.
Subset.
Period range or date range.
Depending on convenience and need, derived tables can also be renormalized.
Recommendation: Evaluate, throughout the implementation, whether segmentation, partitioning and denormalization need to be performed for all events, can be done as needed in types of events with many occurrences. However, adopting a uniform and scalable choice can reduce the amount of code, since in this manner exceptions to the rule are avoided.
Recommendation: perform the partitioning by date and the segmentation by type of event and subset. The partitioning by date will be implemented using the respective functionalities of PostgreSQL, while the segmentation is implemented with a simple creation of tables of events by type of event and subset.
E1.4 - Incorporation Stages
For the incorporation stages the following alternatives were considered:
E1.4.1 - (Alternative 1) Calculate and Compile
Raw data download: when the dataset is retrieved from the source and in its raw state.
Import: **canonical data **are imported in the format as they are provided by the source, performing corrections and data validations only for error correction, checks and format conversion.
Calculation of Computes: performing crossing of canonical data of events and frames and storing the result in derived structures without segmentation/partitioning/renormalization.
Compilation: when the computes are segmented/partitioned/renormalized to optimize dynamic queries.
E1.4.2 - (Alternative 2) Compile and Calculate
Raw data download: when the dataset is retrieved from the source and in its raw state.
Import: **canonical data **are imported in the format as they are provided by the source, performing corrections and data validations only for error correction, checks and format conversion.
Compilation: when the computes are segmented/partitioned/renormalized to optimize dynamic queries.
Calculation of Computes: performing crossing of canonical data of events and frames and storing the result in derived structures.
E1.4.3 - (Alternative 3) Segment and Calculate
Raw data download: when the dataset is retrieved from the source and in its raw state.
Import: **canonical data **are imported in the format as they are provided by the source, performing corrections and data validations only for error correction, checks and format conversion.
Calculation of Computes: performing crossing of canonical data of events and frames and storing the result in **derived structures modeled with ** segmentation by type of event and frame, in addition to partitioning by data.
E1.4.4 - (Alternative 4) Partition, Segment, Calculate
Raw data download: when the dataset is retrieved from the source and in its raw state.
Import: **raw data are canonized, **that is, they are imported in the format as they are provided by the source (raw data) and optionally partitioned by date, performing corrections and data validations only for error correction, checks and format conversion, such as in the correction of wrong dates.
Calculation de Computes: performing **crossing **of events and frames and storing the results in derived structures modeled with segmentation by type of event and frame, in addition to optionally partitioning by data, task performed by the Library of download and incorporation.
Compilation: optionally and if necessary, computes can be segmented/partitioned/renormalized to optimize dynamic queries, task performed by the Library of analysis (API).
Next, a brief discussion of the prons and cons of each optimization.
Compilation: The first alternative facilitates the coding of the computations, but it can cause rework in the compilation stage, that is, it requires more database queries and additional code. On the other hand, compilation before computation encoding (second alternative) can make data crossing quite complex, as the purpose of compilation is to reduce database access by producing content in the structure used by the frontend application (cache of the Panel). In general, it is recommended that data stored in the frontend cache be compiled only when needed, with preference for data caching without compilation.
Partitioning: While partitioning by date can have a performance boost in accessing data during calculations and other queries, it can complicate calculations due to limitation of use of external keys in tables, in the case of PostgreSQL, which can be a limiting factor in the case of crossing relational information between tables, but it should not be a problem in the case of geospatial crossings.
Segmentation: As the number of clippings tends to be much smaller than the number of events, it was decided to recommend its segmentation, which can reduce the size of tables and keep events separated by clipping by default, but causes any relationships between two distinct type clippings to require JOIN queries. Other possibilities can take into account sub-partitioning instead of segmentation, but they can add many levels of complexity in database maintenance.
Chose approach
During implementation, all these alternatives were evaluated, and the following approach was chosen with a view to a generic, scalable solution and avoiding creating exceptions in data handling:
Incorporation flux of the ELT type (Extract, Load, Transform), where the canonical data is downloaded, and then loaded in the database and just then transformed to the adopted datamodel.
In the transformation stage, both calculation of computations and compilations occur to optimize queries.
It was opted for partitioning by type of event.
Use of various database optimizations such as indexing and avoid fragmentation of inserted data, ordering events by date when including them in tables.
E1.5 - Frequency
During preliminary evaluations, the following possibilities for selecting time intervals were considered:
Arbitrary selection.
Mandatory division at fixed intervals (monthly, yearly etc).
Possibilities of range of dataset:
Full: Datasets are entirely from oldest to most recent date.
Partial: Very old data is not used due to the availability of computational resources.
Considerations regarding query speed (queries) to the database and storage space were evaluated and thus the option of arbitrary selection of dates was chosen.
E2 - Subsystem of download and incorporation (“importer”)
The importer subsystem of Alertas+ is responsible for the import and
data crossing.
E2.1 - Requirements
Subsystem of collection of dataset is divided into different
importers (importers), each one of them responsible for:
Download the set of raw data from the endpoint to making the datasets available.
Embed downloaded datasets into tabular and geospatial databases (canonical and derivative data).
Being able to run periodically and automatically, working both to feed empty databases (no data) and to update existing databases.
To be able to run on a GNU/Linux operating system without a GUI, for example in a cronjob.
Be compatible with the data model specified in this document.
Therefore, it is up to each importer not only to download the raw data but also to incorporate it into the canonical and derived databases according to the chosen model. For that, it is necessary to cross the events with the clippings during the process of data feed in the databases.
E2.2 - Incorporation Flow
The incorporation flow of data must be a static routine (generates data that are stored), automatic (runs without manual intervention) and periodical (runs with a frequency to be defined), and must be in conform with the following diagram:
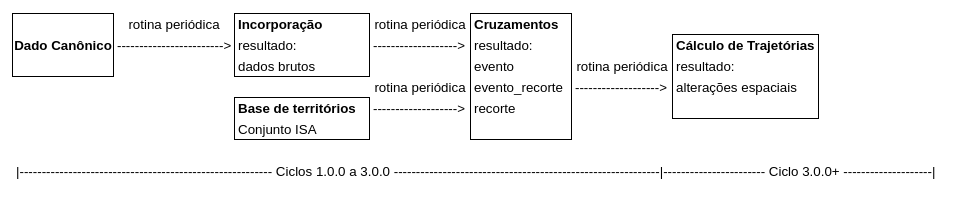
The crossings are produced in the encounter of event data with existing databases under geospatial frames and in compliance with the datamodeling cited in item E1.2.
The import subsystem has generic scripts and libraries that greatly reduce the amount of code needed by each importer, also taking care of the creation of import metadata consumed by the query panel.
The results are calculated for each protected area, (deforestation, fire) so that there is the possibility of viewing the protected areas individually.
Most of the importers adopt the pipeline Extract, Load and Transform (ELT), but other lines are supported, like Extract, Transform, Load (ETL) or even simpler ones like LT (Load, Transform).
Transformation phase routines are divided into “operations” that perform specific crossover and analysis tasks.
E2.3 - Breakdown of DETER classes
In the specific case of DETER, the breakdown of classes mapped by ranges of arbitrary periods will be altered in relation to the canonical established by INPE.
The scheme of the canonical classes is described in the following table:
| Class level 1 | Class level 2 |
|---|---|
| Deforestation | deforestation with exposed soil |
| deforestation with vegetation | |
| mining | |
| ----------------------- | -------------------------------------- |
| Degradation | degradation |
| fire scar | |
| ----------------------- | -------------------------------------- |
| Logging | selective logging type 1 (disordered) |
| selective logging type 2 (geometric) |
However, Alertas+ uses the following classification:
| Class level 1 | Class level 2 |
|---|---|
| Deforestation | deforestation with exposed soil |
| deforestation with vegetation | |
| ---------------- | --------------------------------------------- |
| Mining | mined area |
| ---------------- | --------------------------------------------- |
| Fire | fire scar |
| ---------------- | --------------------------------------------- |
| Degradation | degradation |
| selective logging type 1 (disordered) | |
| selective logging type 2 (geometric) |
Motivation:
This categorization helps to more explicitly compare fire spot events with DETER data, discriminating the importance of fire effects.
Allows you to isolate fire scars to correlate with other sources of heat sources.
Events in the “degradation” category generally precede deforestation, and may or may not result in clearcut deforestation.
Fire can or can not be part of the deforestation process.
Individualizing the “mining” category allows specific analysis of this type of pressure/threat to protected areas.
Examples:
Fire scars occur at PIX (Xingu Indigenous Park), but little degradation or forest degradation.
Degradation can be associated with the beginning of clearcut logging.
Invaders occupy an area and burn the vegetation below the forest canopy (borers).
After burning and/or removing trees from the understory, deforestation activities may involve the removal of larger trees using a chainsaw or the use of agricultural machinery if the land does not present large trees of economic interest.
In the south of Amazonia, in the transition to the cerrado, there is an occurrence of fire unrelated to deforestation processes, but rather with the practice of landscape management or agricultural systems (i.e. fires that escaped from farms and can become large forest fires extensions).
It should also be noted that in the eventual case of incorporating data from DETER Cerrado, it is data without class division, that is, all events refer to cleacut logging alerts and thus classified as such in the import routine. By doing this, the two datasets are compatible (Legal Amazon and Cerrado), allowing a single selection in the interface since both share the same type of event.
For current information about definition of classes of DETER, check config.py do respectivo importador.
E2.4 - Breakdown of classes of other types of events
For other types of events, the canonical definition of classes was preferably followed or, in the absence thereof, a classification was carried out according to the vegetation cover existing at the place and date of the event.
The most current information on class definition are in config.py of each importer.
The following list is just an example for the level 1 classes.
For Amazon Dashboard fire events:
Level 1: Refers to the type of fire:
1: Savana e pasto (savanna and grassland).
2: Agricultura (small clearing and agriculture).
3: Sub-bosque (understory).
4: Desmatamento (deforestation fires).
For FIRMS active fire spots:
Classes determined according to vegetation cover at the place of occurrence, using MapBiomas collection 5 for this (https://mapbiomas.org/colecao-5) and considering the vegetation cover respectively to the date of the event.
For Prodes deforestation:
Level 1: single class (deforestation).
For SAD alerts of deforestation and degradation:
Level 1:
1: Deforestation
2: Degradation
E3 - Subsystems of analysis (“query” and “API”)
The role of the subsystems of analysis is to produce analytical computations on the collected data, being a dynamic routine (calculates and returns data without storing them in banks), automatic (does not require manual intervention to perform) and aperiodic (rotates only according to data requests).
E3.1 - Analysis flow
The computation of the analyzes is represented according to the sequential interaction diagram below:
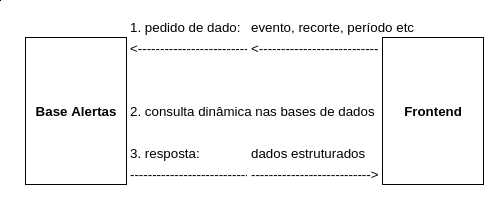
The production of the analyzes will be obtained through calls made from a frontend having as destination an API that will carry out the dynamic queries (queries) in the databases discussed in section E1.2.
All of the following analysis are considered according to the model proposed in the previous section “data modeling”, so that in the future it will be possible to easily reuse the routines developed for new datasets (events and classes).
E4 - Shapefile of protected area kept by ISA
Protected areas (Indigenous Lands and Conservation Units) in the Legal Amazon were digitized in a GIS environment (geographical information system) based on the descriptive memorials of official documents for the creation or alteration of the perimeter. Areas are plotted at 1:100,000 scale. For the state Conservation Units, we adopted the ICMBio/MMA databases as a reference for spatial data, complemented with information from the state agencies of SISNAMA. When there is no descriptive memorial of the protected area or if it has errors that prevent the plotting of the perimeter, vector and matrix data obtained from official federal and state agencies (i.e. FUNAI, MMA and state secretariats) are used for review and/or complementation, as well as non-cartographic documents such as, for example, management plans for Protected Areas.
The spatial data of municipalities and states used as reference for plotting protected areas originates both from SIVAM (Amazon Surveillance System, 2004), on the 250 thousand scale, and from the continuous cartographic base for Brazil on the 250 thousand scale (IBGE , 2015). In addition to these official databases, global rasters (i.e. Google) and satellite images from the Landsat series also assist in the boundary construction process if there are limitations in the vector data.
All features were transformed to the geographic coordinate system and referenced to Datum Sirgas 2000.
E5 - Buffers and Masks
Currently and for an individual ARP, the event count is calculated within the spatial unit and in three simple buffers:
From 0 to 3km: coming from the UC regulations; in the case of ITs, it would be for compatibility.
From 3 to 10km: arbitrary value.
From 0 to 10km (sum of buffers 1 and 2): also arbitrary value.
The spatial data referring to buffers in protected areas were delimited in a GIS environment using the buffer function.
For later development cycles, other possibilities of buffers that can be created with more complex criteria can be considered, including those “into the ARPs”.
In the case of datasets that span beyond Legal Amazon, a mask is applied to limit the derived set of events to the Legal Amazon only.
E6 - Analytical outputs
The analysis periods are arbitrary and are characterized by start and end dates, and may also represent periods defined as daily, biweekly, monthly, annual and total.
The outputs of the panel that integrates the data involve the following results:
Total area (and by level 1 classes) of DETER alerts (annual, monthly and accumulated) in the following spatial subsets: Indigenous Lands, Conservation Units, 3km ARP buffer and 10km ARP buffer); municipalities (MUN), Federation Units and hydrographic basins. 2. The results bring the occurrence histories in each territorial unit, including the buffers, within the limits of Legal Amazon, which can be accumulated historically, annually, monthly or any other necessary calculation.
The Environmental Protection Areas (APAs) can be selected separately, that is, distinctly from the set of UCs.
Occurrence of overlapping between deforestation in different periods. For these cases, it is necessary to make an accounting and eventually confirm with the responsible technical teams for each set of data to understand the methodology and the reason for these cases, perhaps as a data quality control.
As for the future development cycles, the following analysis can be considered and are compatible with the adopted data model:
Geometry/class changes over time, answering the following question: What are the trajectories of the event classes (level 1 and 2)? The panel could present what happened in a given period (free choice) by geographic unit (TI or UC). An example is the platform Mapbiomas, that presents the evolution between two distinct periods of class change. In this alert panel, the changes that occur between classes 1 and 2 would be represented.
Modifications over time in the area of each class as a result of the dynamics of the deforestation process, answering the following question: How many of the events - degradation class and/or logging - were transformed into events (polygons) of the deforestation class?
E7 - Dashboard
Alertas+ dashboard has:
Available datasets on deforestation and forest degradation.
Typology of territories: protected areas, corresponding buffer, states and municipalities.
Specific selectors for the selection of protected areas, states, municipalities and hydrographic basins.
Time frame selector: start date and end date.
Tempoal scale selector of results: annual, monthly and quarterly.
Display selector for spatial units on the chart: 5, 10 or 20 units.
Interface with comparting tool between spatial subsets, dates and alert sources.
E8 - Range
First public version: Legal Amazon, with the selection of municipalities restricted to those present in this scope.
Later versions: may have greater coverage, eventually including Cerrado and other regions.
In the case of INPE sets, it was noted that TerraBrasilis currently offers sets for the Legal Amazon and the Cerrado biome. There is an overlap between both sets, as part of the Legal Amazon is overlaid with part of the Cerrado biome.
There is a hypothesis that INPE follows, in this case, the same logic as Prodes: it maps forest fragments in the Cerrado biome and, based on a spatial analysis, the overlap between the polygons is verified.
So, in later cycles it will be necessary to adapt the routine of canonical data import to exclude this duplicity, for example, separating what refers to the Legal Amazon and Cerrado biome, but the latter does not have a variety of mapped classes, that is, they are just “deforestation warnings”, while with the first one we have more classes (clearcut logging, fires, mining etc.).
E9 - Hydrographic Basins
An ANA canonical database was used with revisions carried out by ISA, which resulted in a derived river basin base including adjustments for the Rio Negro and Xingu basins.
The canonical data presents inconsistency due to its relief and methodological problems that bring consequences in the level of resolution for the work that ISA performs in these two regions.
Thus, improvements and even manual adjustments were made to correct situations in which the hydrographic basin ended before its own river mouth. Numerically, the resulting hydrographic basin is not very different, but it is in terms of pattern and shape.
Alertas+ uses level 2 of hydrographic basins of this dataset.
The form of incorporation of the basins differed from the other territorial sections, and was worth a note about it in the section “Assumptions, characteristics and limitations”.
E10 - Carbon emission estimate
Alertas+ has an operation to calculate carbon emission estimates associated with events.
This output is implemented but is in an experimental stage of analysis, in comparison with other estimates and calibration of emission parameters, and its use is not yet recommended.
The Alerts+ query interface already has the accounting of the impact caused by the events analyzed by the user, providing the equivalent in emitted carbon, but this functionality is currently disabled and pending final approval.
Despite the unavailability of this data in the consult panel and the recommendation that it not to be used yet, this information is already routinely calculated by the system, being available for consumption via API and also capable of being calculated independently using the source code of Alertas+ and the input files (biomass map, vegetation cover map and sets of event).
The assumptions involved in these estimates are discussed further in the section “Assumptions, characteristics and limitations”, while this section will try to explain in general terms the calculation algorithms and what theoretical and methodological references they are based on.
The emission calculation is based on two factors:
Type of event.
Carbon content present at the event location corresponding to the polygon or, for specific events, in the vegetation cover of the point corresponding to the date of occurrence of the event.
The method for estimating the carbon emission is different for polygonal events and for specific events (fire spots), detailed in the following sections.
Calculation for the polygonal case
Type of event. In polygonal events, the emission associated with clearcut events will be 100% of the carbon associated with the polygon. In the degradation polygons, the proportion will be smaller. The emission rate of the burnt and degraded areas classes will be 57% and 35%, based on the research by Berenguer et al., 2014 (A large-scale field assessment of carbon stocks in human-modified tropical forests).
This amount is calculated through an operation of integration of a matrix data representing, with a sufficient resolution, the carbon content per hectare (ha) in the area covered by the system. Specifically, the carbon map used was developed by ESA Biomass Climate Change Initiative.
The biomass density value is extracted in the pre-treatment, from a raster of 100 meters of resolution prepared by ESA, which is the most reliable source of biomass (according to several experts):
To perform the calculation, the emission value per ha is multiplied by the area of polygonal events. To avoid double counting, this computation will be done using the
smart_emissionsfunction, which will calculate the dissolved area of the overlapping polygons and multiply it by the average of the pre-calculated emission density of these polygons. For polygons that do not have overlapping, the calculation will be done by simply adding the individual emission, calculated by multiplying the polygon area by the pre-calculated emission density.
Thus, for polygons – DETER, SAD, PRODES and Amazon dashboard, for example – the carbon emission is calculated by multiplying the biomass density value at the site (polygon centroid), in MgC/ha by the area of the polygon and by the biomass conversion factor (1 for deforestation, 0.57 for fire and 0.35 for degradation). These values were taken from Berenguer et al (2014).
Calculation for the specific case
Type of event. The specific events of fire will have as reference FRP (fire radiative power) value, as per initial survey by Wooster,
This value will be multiplied by an average conversion factor for Equivalent carbon emissions, as reported by Kaiser (2012), which averages
39.71 * 1.39 = 55.20to get tons of carbon equivalen emitted by each spot detected.
But, to obtain a more accurate estimate, a more elaborate procedure was adopted, consisting of the following additional steps:
Calc in spreadsheet of emission factors by soil coverage.
Preparation of annual maps of land cover from Collection 5 of Mapbiomas
The final calculation of emitted carbon will be made by simply adding the emission corresponding to each event, in the case of hot spots,
For specific data – FIRMS fire spots, for example – the calculation of carbon emissions from fires is an important research topic in the environmental sciences.
In the present development, classical references were studied (mainly Kaiser et al, 2012) to determine the relationship between firepower (the FRP parameter, available for each event) and the associated carbon emission.
Other bibliographical references and consultations with INPE researchers resulted in the definition of an average factor of 55.20 Mg/W, that is, the daily gross carbon emission of an active heat source, in tons, is equivalent to 55.2 times the FRP.
Even so, it was deemed necessary to:
Prepare a raster containing several bands – one for each year since 1984 – of vegetation cover.
Classify the events of fire spots according to the ground cover for the year of occurrence of the spot.
Calculate emission factors according to land cover selected from Collection 5 of Mapbiomas.
Emission factors are defined for each imported in its config.py
configuration file, which allows emission calculations to be easily calibrated.
Overlay treatment
Solving the overlay treatment was the biggest difficulty found in the implementation:
The problem: when calculating the total emission associated with a user request, the emission values of each event are added to deliver the total value. The problem arises when there is overlap in the selected events. For example, if the user wants the total emissions in buffers of TIs, such buffers can overlap in the case of contiguous TIs, and thus the associated events are fully or partially duplicated. It may also be the case for a selection of TIs and UCs that have overlaps.
The precise solution: the most accurate way to calculate these emissions would be to dissolve these polygons, cut out (clip) the biomass raster and calculate the total biomass associated with that cutout (clip). Unfortunately, this processing takes hours, which makes it unfeasible for this panel proposal. Another option would be to convert each polygon into a prism, with height equivalent to the biomass density, and at runtime do a dissolve and volume calculation in three dimensions. This option also turned out to be too slow and unfeasible.
As a solution adopted, the separation of polygons that have overlapping and those that do not have been performed. The emission corresponding to the first ones is done in a simple way, adding the emissions to the features of the polygon. On the other hand, overlapping polygons follow a different process, that is, a dissolve in area is performed and the average value of emissions per ha is calculated. This average value is then multiplied by the total dissolved area.
We estimate that the error associated with this simplification is not very large, because the proportion of overlaps is low (between 5 and 10%) in the case of not considering buffers. For analysis that incorporate buffers the error may be larger, but we believe that the associated error is much smaller than the error associated with the other parameters of the calculation.
The emission factors for each type of event will be recorded in the corresponding configuration files:
In the case of polygonal type events, the factor refers to MgCe/ha.
In case of specific events, the factor unit is MgCe/MJ.
Procedure for generating the map of biomass
To generate the carbon (biomass) map, the following manual procedure was used:
Download of GeoTIFF files provided by ESA Biomass Climate Change Initiative.
Map assembly from downloaded GeoTIFFs using QGIS to create a unique raster.
Outline of the area of interest.
Conversion to an importable SQL query.
This map of biomass is available at the Alertas+ downloads page.
References
E. Berenguer et al. (2014) A large-scale field assessment of carbon stocks in human-modified tropical forests, DOI 10.1111/gcb.12627.
J.W. Kaiser et al. (2012) Biomass burning emissions estimated with a global fire assimilation system based on observed fire radiative power, DOI 10.5194/bg-9-527-2012.
E11 - Shapes and dynamic of data ouptut
For the production of maps and other analysis by web platforms, the results obtained must be organized to be made available in the following formats:
Open structured format (CSV, JSON e GeoJSON).
Vector format (shapefile).
Raw format (tabela SQL ou raster).
Interaction via web services (API RESTful).
Tiles for dynamic use (Tile Server in MVT - Mapbox Vector Tiles format).
The following subsystems take care of the data outputs:
Part of the output is produced dynamically (“query” and “API” analysis subsystems). The system API can be consulted programmatically or interactively, in the latter case through the API page of Alertas+.
Another, more static part is produced by an export subsystem (“exporter”), and is available for download via:
Direct use of the import subsystem through the use of the system backend.
Static files are automatically and periodically exported from the system and are currently restricted to non-event data such as territory shapes and biomass and vegetation cover maps.
Event data can be obtained directly from canonical sources.
E12 - Operational management system
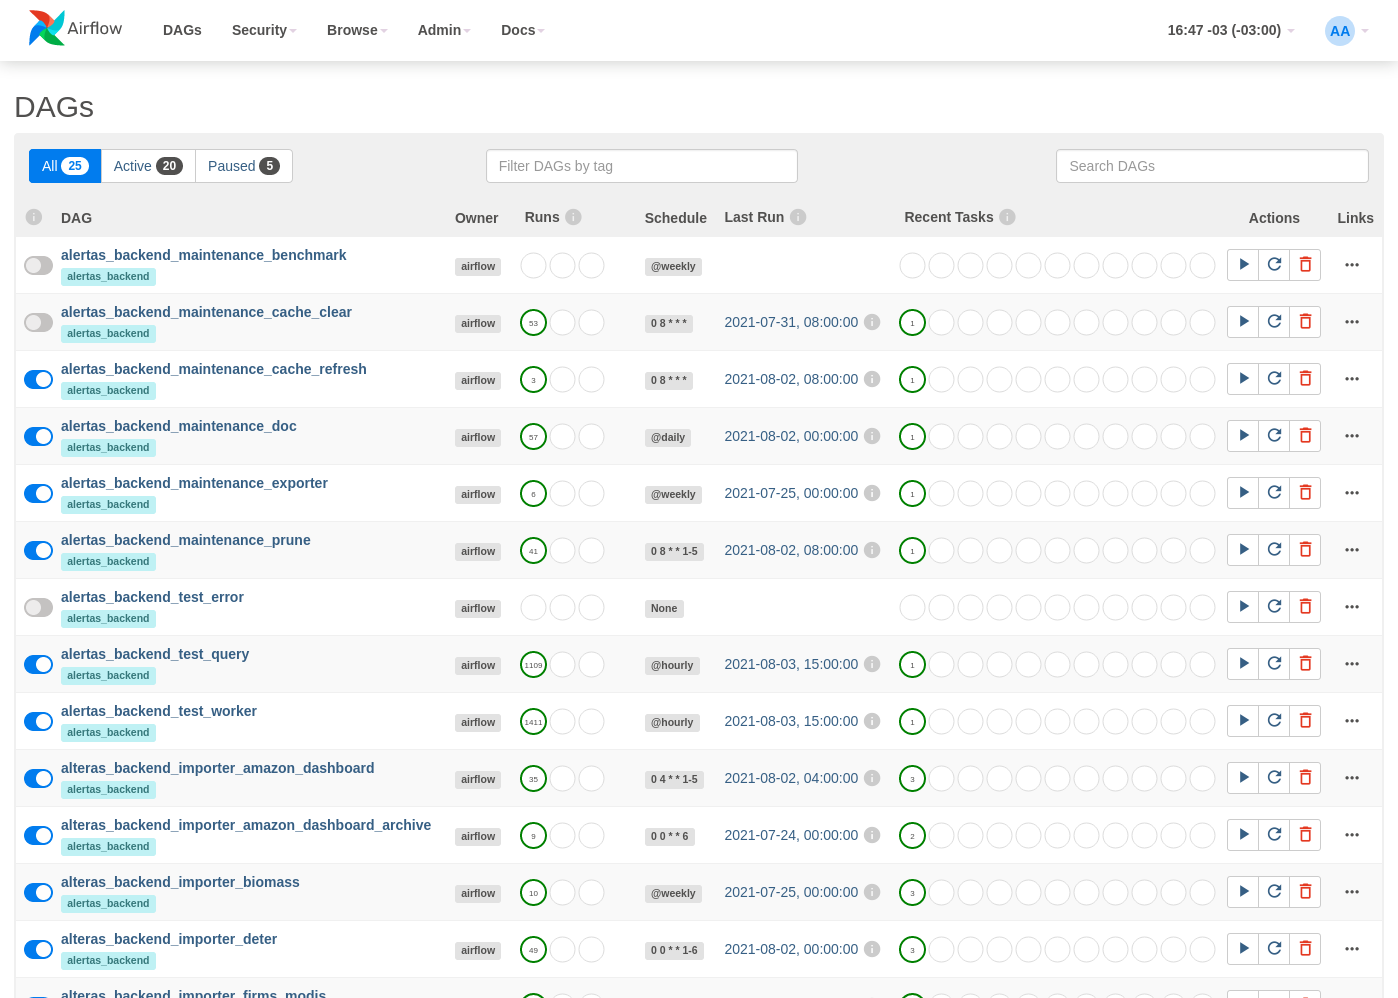
For the monitoring and operation of the system, especially to follow the data incorporation flows as well as to respond to errors, Alertas+ has an instance of Apache Airflow.
As with the periodic maintenance routines, each importer has its own routine in Airflow, as shown in the image below:
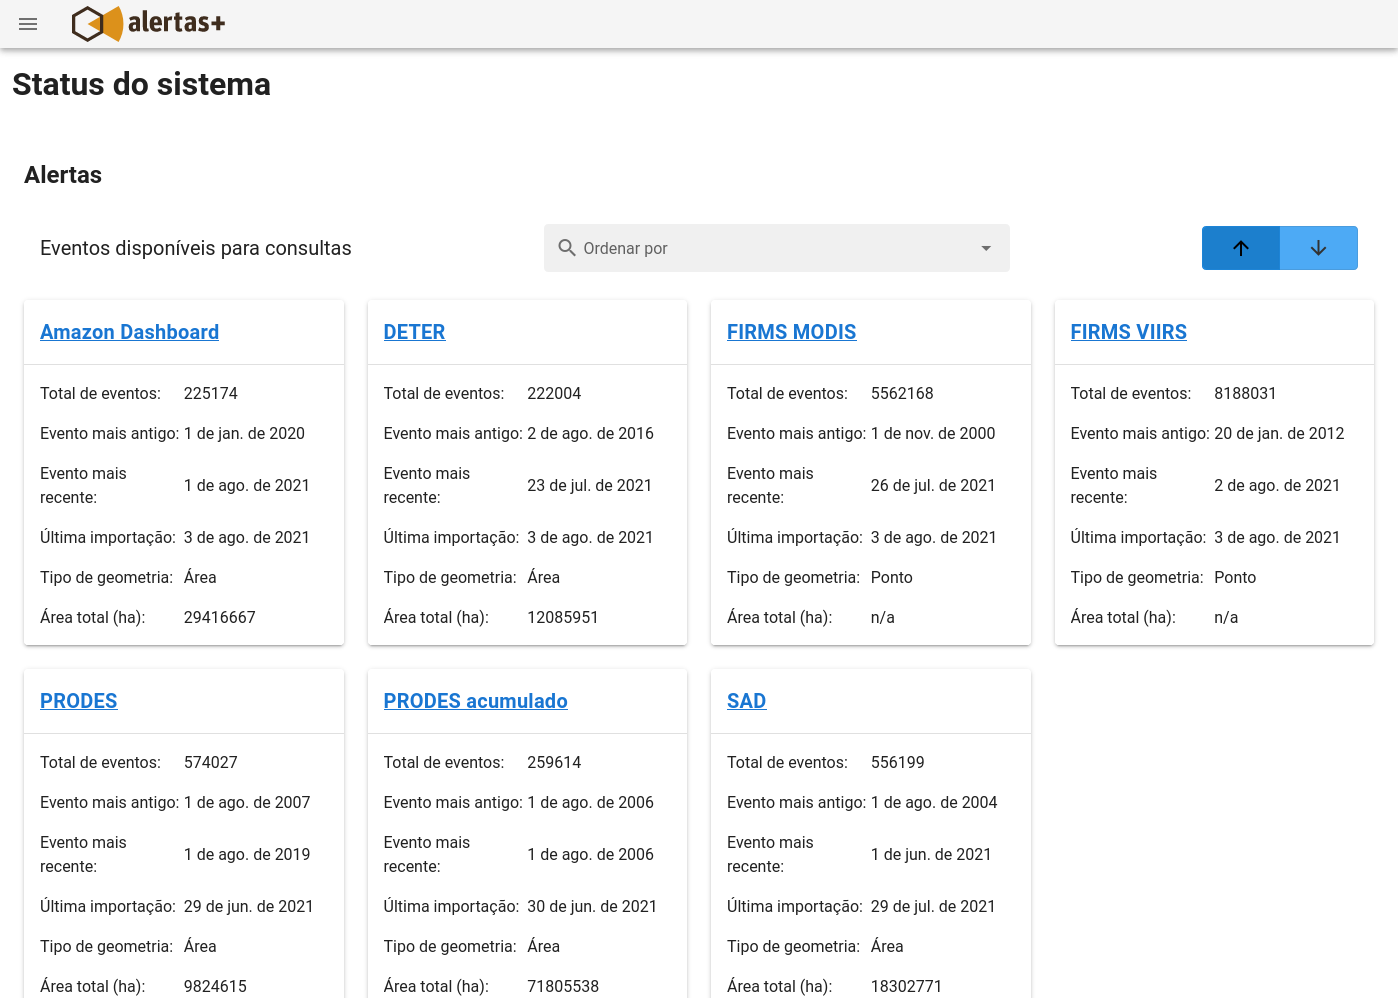
Alertas+ also has a public status page reporting the most recent condition of the datasets:
Assumptions, characteristics and limitations
In constructing Alertas+, a special effort was made to document explicitly and to the maximum extent all assumptions and approaches adopted not only from the datasets used but also from the design and implementation choices.
Such assumptions helped to define the applicability of Alertas+ as an expeditious near real-time alert system.
When possible, the approval process still worked to critically assess the validity of assumptions.
Instantaneity of events
The system assumes an instantenity in events.
Unlike, for example, Amazon Dashboard, Alerts+ does not record the start and end of events, such as the start and end of fires, both for the simplicity of the model and to facilitate the use of the interface, as not every dataset has the end date. This assumption works for analysis over long periods, but for short intervals it is imprecise and fails especially when the interval is shorter than the event duration.
Events are assumed to occupy a single date (daily scale), but the event may actually have been shorter or longer. This assumption is implicit both in some data sets (FRP product of VIIRS and MODIS) and in the Panel’s own data model (event on a date with day/month/year); other systems like Amazon Dashboard consider a fire start and end date, while this Dashboard only considers a single date (equivalent to the Amazon Dashboard “start date”).
Date of events
For some datasets, the event date refers to the date of detection and not the date of occurrence, such is the case of DETER and PRODES:
In DETER it is especially relevant to understand the distinction between
occurrence time and detection time. A forest can be deforested step by step,
but its detection as a clear cut or degraded area occurs only when the
conditions for observation by the satellite are favorable. In DETER, any
deforestation alert detected in an image, and that was not detected
previously, is considered new deforestation regardless of the actual date of
occurrence of the event.

DETER data may include deforestation processes that occurred in periods
prior to the month of mapping, whose detection has not been possible,
due to cloud coverage limitations or image availability. For this reason,
it is necessary to distinguish between the time of occurrence and the
opportunity of detection.
This is because it is information based on images of the affected land that is obtained periodically and not necessarily at the time when forest depredation occurs.
In other types of events such as Amazon Dashboard and FIRMS, the date of occurrence is closer to what actually occurred as they are based on fire detection (fire spots) in the periodic passage of satellites with MODIS and VIIRS sensors (the latter with high resolution ).
Absence of regenerative processes
The system only assumes the forest degradation process and we do not estimate regeneration rates at any level. Thus, the values accumulated in the Panel (deforestation, forest degradation and estimated carbon emissions) may be higher. For long periods this difference can be significant, while for “near real-time” it can be negligible.
Temporality of Protected Areas
All calculations on Protected Areas consider them in their most recent perimeter, that is, the system does not take into account previous events of the ARPs or even if they existed or not on the date of registration of an event.
Even if an ARP was created after an event, the system considers that the same occurred in the area delimited by the ARP.
Despite the simplification that does not consider the historical dimension of the creation and alteration of ARP boundaries, the assumption allows for an analytical consistency of the threat history in the territorial outline.
Simplicity of buffers
As mentioned in section E4, the system currently has simple surrounding areas (buffers) plotted automatically for each ARP.
These simple buffers do not take into account overlaps between ARPs and between buffers of close/overlapping ARPs.
To avoid double counting of events and affected area, queries to the system database take such overlaps into account through a pre-computation process of a special “smart area” algorithm to obtain data without double counting in a fast way.
Other buffer area type clippings can be considered in the future, such as those that consider only the portion of the territory outside the ARPs, that is, without overlapping with other ARPs.
Carbon emission estimates
Overall, it is considered that there are still a number of inaccuracies in all carbon emission estimates, not just in Alertas+.
The main reason is the large uncertainties in carbon stock estimates.
Even so, it is believed that the Alertas+ estimates can be used in the near future as general indications of emission in the territories, depending on a better calibration of the algorithms, possible improvements to the biomass map and an approval process that can better assess the involved uncertainties.
Methodological issues
Among the methodological issues, the evaluation of some assumptions is pending, such as:
For cases of clearcutting by full burning, it is assumed that 100% of the vegetation is emitted (coefficient 1). How strong is this assumption?
For the calculation of emission in fire spots events:
It is implicitly assumed that the focus has burned with the same power for 24 hours. It may or may not be a strong premise that needs to be analyzed.
It is necessary to confirm that FRP is nowadays a product that already has all those corrections applied manually by Kaiser et al. (2012)
Confirm the experimental reference of the relationship between FRP and emission given by Kaiser et al. (2012), for example by checking if there was an experiment or measurements on the ground together with the satellite.
Date of the map of biomass
When adopting a 2018 carbon/biomass map, there is an implicit premise of assuming 2018 coverage as retroactive to events prior to that date.
That is, it may be that the map indicates a lower presence of carbon if it is used for events occurring before 2018.
In addition, it is possible that from 2018 until now these areas have also been changed, that is, there has already been a loss that the system reports associated with a given event.
In short:
Pre-2018 estimates may be conservative, that is, the biomass reported in 2018 at one site may be less than the biomass existing at the date of the event.
But post-2018 estimates tend to be better.
A possible correction would be to also use older maps and compute losses referring to a given date from the map closest to that date.
Overall, emission estimates based on carbon maps still have large uncertainties, especially as these maps are still produced with high uncertainties, which should be improved in the future with the availability of new data.
PRODES and PRODES Accumulated deforestation
When importing the PRODES dataset, events were separated into two types:
Accumulated deforestation until 2007, in a type of event
PRODES Accumulated.Annual deforestation from 2008, in a type of event
PRODES.
It is worth noting that, in the case of datasets such as PRODES, the dates do not refer to actual events but to annual values in each territorial area.
The Alertas+ search interface only allows the annual selection of PRODES data and currently does not allow the selection of Accumulated PRODES data, which are nevertheless in the database and can be used in specific calculations of total deforestation accumulated up to the recent date of the set.
Deterministic computing, idempotency and reversibility
The Alerts+ system is of deterministic computing – that is, it runs the imports over and over again with the same input dataset produces the same result.
All data importers have idempotency, that is, they can be run more than once and will produce the same final import state with the same set of input data. Evidently, as the data is updated at the source, the system will tend to produce updated results as well.
The system is not reversible computing, that is, there is no output data reversal procedure that retrieves the input data. Thus, the checking of the results data for the system approval was carried out through parallel comparison made manually by geoprocessing analysts.
Of the absence of events
The absence of recorded events is not evidence of the absence of events that have occurred. Limitations in detecting sensor systems may occur.
Discounting false positives, it can be assumed that the actual amount of events is greater than reported by the system due to occasional failures in the detection of the data used, that is, the system can underestimate but hardly overestimate the alerts.
Treatment of overla of events
Some sets require handling to avoid overlap between events.
In the case of DETER, the overlaps not allowed in the system are those of polygons of classes that involve the complete and definitive removal of forest cover, which are represented by categories 1 (deforestation) and 2 (mining). Polygons from other categories may have internal intersections – this would be the case, for example, of a place that has several successive fires – or external intersections with class 1 or 2 polygons – in the case of an area that is initially burned or degraded and then later deforested.
Treatment of hydrographic basins
Hydrographic basins are not treated as an additional territorial feature, but rather in a special way.
To avoid overloading the bank with new intersections, the treatment that is given
is through a spatial JOIN: each polygon or point resulting from the intersections
of events with territories is assigned a basin, based on the position of the point or centroid.
This does not bring significant inaccuracies, due to the difference in scale between
basins and events, and is much faster as it does not overload the system by doubling
the size of the event_territory table.
Such methodology has the problem of not tolerating overlapping between polygons in the shape of basins. There are allowed gaps but no overlaps.
Therefore, and due to the geographic extension of the hydrographic basins, which exceeds the average size of deforestation and warnings integrated in the system by several orders of magnitude, it is proposed to cross-reference the polygonal events with the centroid of each polygon as a reference, avoiding performing intersections in the polygons themselves.
This change, which has a minimal error associated with it, should optimize system performance.
It is estimated that by keeping with this methodology the cost of integrating the new analytics layer was insignificant in terms of storage and performance.
Temporal grouping of results
The system supports the temporal aggregation of events on the daily, weekly, monthly, quarterly or annual scales (“temporal unit”).
In the case of annual scale sets (PRODES), data are already aggregated annually on the start date of the period (01/08/2019 for the Year PRODES 2020, for example).
For monthly scale sets (SAD), daily and weekly aggregations are not supported.
The system API has options for event aggregation to occur at the beginning or at the end of each period, in the case of weekly aggregations onwards.
Comparison between systems
It is important to take into account the territorial frame in the Alertas+ search interface when you want to compare the data presented by the system with the raw data of each set.
When a selection is made, the total and the area of the alerts reported consider their overlap with the territorial selection performed (intersection of events with territories).
This was implemented through a breakdown of events by territory in the
event_territory database table.
For each territory where an event overlaps, there will be an entry in event_territory
for that event, but with different geometries given by the intersection of the territory and
the event. Includes more than one territory.
Consequently, what in some datasets (such as DETER) is called a warning/alert/event may not be exactly the same event reported by Alertas+ due to the chosen territorial selection that will only present the excerpt of the alert that is intersected with the chosen territories.
That is, depending on the selection made, the alert of the original data can be presented in a selection only in the portion in intersection with the chosen territorial frame, both in the displayed polygon and in the quantification of the affected area.
In the case of the most comprehensive selection of Alertas+ (for example, all municipalities or states), there will be a coincidence in the reports as there is no territorial restriction to be applied.
Also, to avoid double counting of event numbers and total area, some selections are restricted in the event query:
Selecting event quantities have
DISTINCTconstraint on the event ID, to avoid duplicate selection and counting of events.MUNandUFterritory types cannot be selected along with other territory types as the event (and possibly area) counts would be doubled as these territories are always superimposed on protected areas and their buffers.
In other words, an alert that originally covered more than one territory can become N events during the crossing (disaggregation of events by territory), but which WILL NOT be displayed in duplicate in the selections.
As an example, an environmental alert spanning two ARPs becomes two environmental incidents of equivalent area after processing the canonical data.
The situation is analogous for the case of specific events, as they can occur in a place with territorial overlap.
Alternative measuring units
In the Alerts+ query interface, it is possible to switch between measurement units (square kilometers, hectares, etc.), and the expression of areas in:
Football fields, using the CBF/FIFA standard of
105m x 68m.Estimate of mature trees cutted down for the Amazon biome, based on the article by Steege et al. (2003) A spatial model of tree α-diversity and tree density for the Amazon and that calculates the number of mature trees per hectare of standing forest between 400 and 750; Alertas+ uses the average between these values, or 575 mature trees per hectare.
Such values, despite not appearing in standard measurement systems, are of good communication and help the public to understand the impact of pressure/threat events.
General purpose
The system has a purpose of socio-environmental diagnosis and impact on public policies and, therefore, the criteria was not only scientific accuracy, but also bluntness and agility.
It is not a system with time-consuming calculations to obtain arbitrary scientific or even forensic accuracy, but rather a system that quickly produces good estimates within tolerable margins of error.
The system allows for quick search and selection of events, which can be complemented with a detailed analysis of the available raw data.
Both data near real time (Near Real Time - NRT) and re-analysis data (Science Ready) are used.
Terminology
Notes on naming.
Alerts
Use of the word “alert” as a synonym for event in the Portuguese version:
Threat: Represents a measure of the imminent risk of deforestation and forest degradation occurring within a PRA. IMAZON uses a distance of 10 km to indicate the vicinity of a PRA in which the occurrence of deforestation and forest degradation indicates threat.
Pressure: Occurs when deforestation manifests itself within the ARP, leading to losses of socio-environmental services and even the reduction or redefinition of ARP limits. In other words, it is an internal process of environmental degradation that can lead to legal and environmental destabilization of the ARP.
Alert: Represents a warning or sign of the occurrence of an event of deforestation and forest degradation.
Fire Spots: Detection of sites with burning vegetation through digital images from satellite sensors. The following terms have the same meaning: fire spot, fire spots, burn spots and active spots.
Area with clear cut deforestation: Occurrence of total suppression of native vegetation.
Area with forest degradation: Occurrence of partial suppression of native vegetation resulting from logging, burning or mining activities.
Number of deforested areas: Quantitative value of deforestation alerts.
Number of degraded areas: Quantitative value of forest degradation alerts.
Protected areas
Protected areas are delimited and managed sites intended for the preservation and sustainable use of a representative set of ecosystems of unique scientific, cultural, educational, aesthetic, scenic or recreational value. The types of Protected Areas are Conservation Units, Indigenous Lands, Quilombola Territories and regulated areas for community use.
Data collection
It is a set of data attributed to the same source, methodology, etc. It can refer to alerts/events but also territories.
Examples:
ISA.
DETER INPE (includes Legal Amazon and Cerrado).
PRODES INPE.
Amazon Dashboard SERVIR.
FIRMS VIIRS.
FIRMS MODIS.
SAD IMAZON.
Dataset
It is a set of data distributed in a single package/file. A single collection can be made up of multiple packages. Depending on the collection, some packages can be incremental while others can represent an entire period or specific periods of the set.
Data collections can also have distinct packages according to specific cuts.
Examples:
The Amazon Dashboard collection can have packages for the dates 20201231 and 20210506 representing different periods of data.
DETER has packages for Legal Amazonia and Cerrado, and the file
deter-amz-public-2021mar29.ziprefers to a date, for example 2021-29-03 and a dataset (amz).
Shapefile
A shapefile is a vector data storage format for storing the position, shape, and attributes of geographic features. It is stored as a set of related files and contains a feature class. Shapefiles typically contain large features with a lot of associated data. Represents a file within a dataset, ie a set of geospatial data within a package.
Examples: the DETER collection has datasets for Legal Amazon and the Cerrado (distributed in different packages).
Thus, the same collection can be fed by multiple importers, each of which can work with multiple datasets and each dataset can have multiple shapefiles. Collections can also be obtained directly from other databases.
Importador (importer)
It is an import procedure for a collection. For example, FIRMS VIIRS and FIRMS VIIRS Archive are two distinct importers for the same collection also named “FIRMS VIIRS”.
Fase (phase)
It is a step related to loading data from the system. For example:
Stage 0: datasets that are requirements for all or most event importers. Stage 0 comprises data such as biomass and vegetation cover maps as well as territory tables.
Stage 1: set of events of periodic import.
Estágio (stage)
It is a step related to loading the database. For example, an import can be divided into the following stages:
Extract: Data is extracted from one or more source locations.
Load: data is loaded into a database.
Transform: Data is transformed to fit a data model.
Linha de importação (pipeline)
It is the sequence of stages in the incorporation of data by an importer.
For example, the ELT sequence is composed of the Extract, Load and Transform stage sequence.
Operação (operation)
In the context of importers, each stage can be broken down into operations, which perform specific tasks on the datasets.
Exportador (exporter)
An exporter is the counterpart of its respective importer, exporting data used or processed by the system so that it can be used by other systems or even used by other people and entities that want to maintain their own Alertas+ instances.
While in an API or other dynamic system the data is dynamically queried, the exporters function is to make a raw, specific and/or periodic export of the data.
Subsistema (subsystem)
It is a modular portion of Alertas+ responsible for specialized routines.